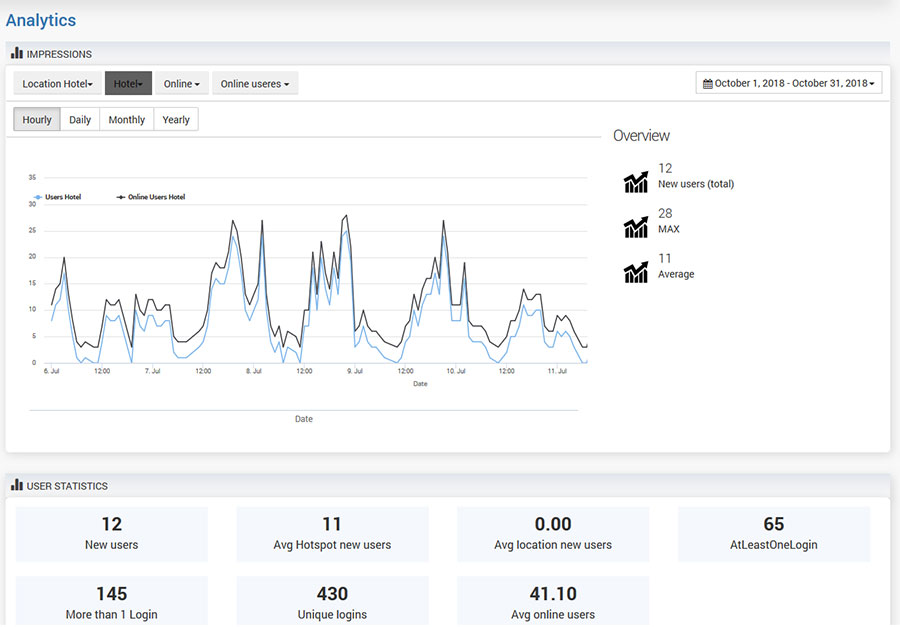
Reports panel gives analytic and statistic details for Impressions, User Statistics, and Top Locations overview.
Impressions diagram show overview details for New users, MAX users, Average users based on the selected time interval.
Results can be filtered and seen for all WiFi Locations, specific Hotspot router, based on all Users, Online sessions, Internet, Splash Portal, or Sales.
Same details can be filtered by Number of sessions, Number of unique logins, Online users, and Impressions.
User Statistics give information for details for the selected time interval for New users, Avg. Hotspot New Users, Avg. Location New Users, At Least One Login, More than 1 Login, Unique Logins, and Avg Online Users.
Top locations diagrams show top locations based on the number of New Users, Online Users, and Max Online Users.

 Reports