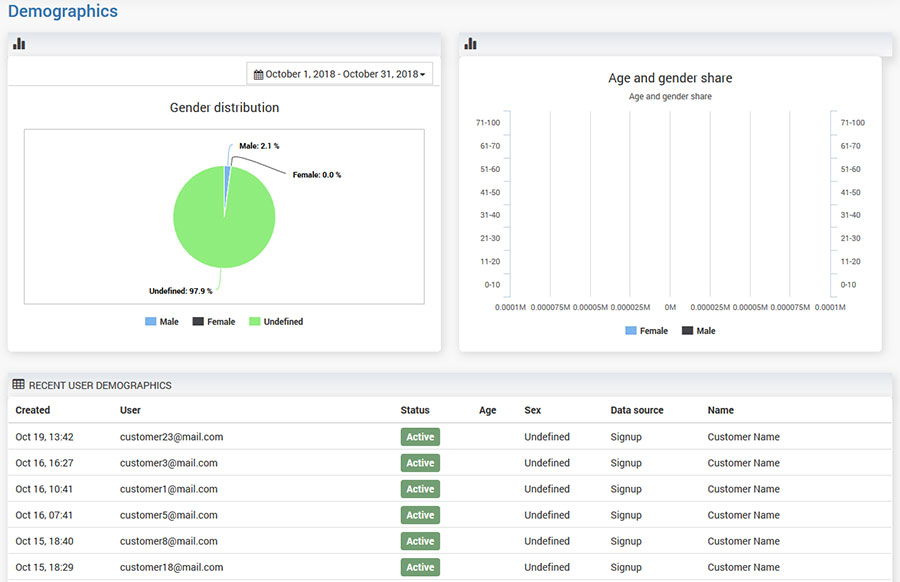
Analytics Demographics panel helps you to identify users and see their structure based on demographic details.
Gender distribution chart pie show users based on gender:
Male, Female, and Undefined.
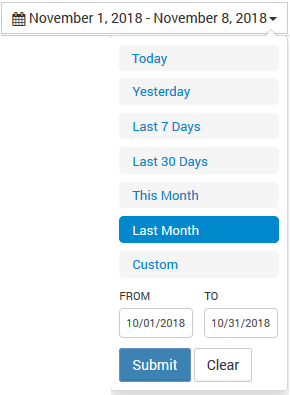
Gender distribution gives information per day and it can be filtered based on time intervals.
Age and gender share give information about the structure of users based on gender and age. Can be filtered by gender to Female and Male.
Recent User Demographics represent a list of the last 20 users.
Available User demographic details are Created, User, Status, Age, Sex, Data Source, and Name.

 Demographics
