The Cloud WiFi Home section of the dashboard offers a summary of your WiFi network’s performance. It’s the first stop for admins to review usage, trends, and system activity at a glance.
Administrators can view key data such as total logins, bandwidth usage, average session time, number of locations, splash pages, and ad campaigns. A built-in Location filter allows viewing statistics for specific hotspots, instantly updating charts and metrics. The dashboard also includes a date range selector and dynamic graphs for tracking user activity, bandwidth trends, and impressions, helping admins monitor network usage and make data-driven decisions quickly.
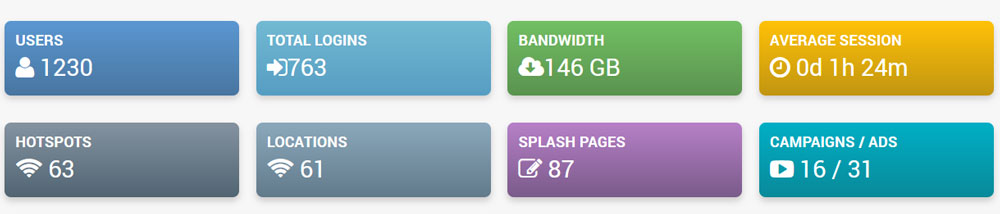
Metrics Panels:
Total Logins – Shows the number of user login sessions across the selected location.
Bandwidth – Indicates total data consumed (upload/download).
Average Session – Displays the average session duration per user.
Locations – Total number of hotspot locations configured in the system.
Splash Pages – Number of custom splash pages created for login portals.
Campaigns / Ads – Number of marketing or ad campaigns currently configured or active.
Date Range Picker
You can set a custom time range for all dashboard data—helpful for tracking trends over specific days or weeks.
Live Statistics Chart
Displays daily stats including:
Online Users (active connections)
Bandwidth (usage trend)
Impressions (likely login portal or ad views)
This visual graph helps analyze peaks in usage and understand user behavior over time.
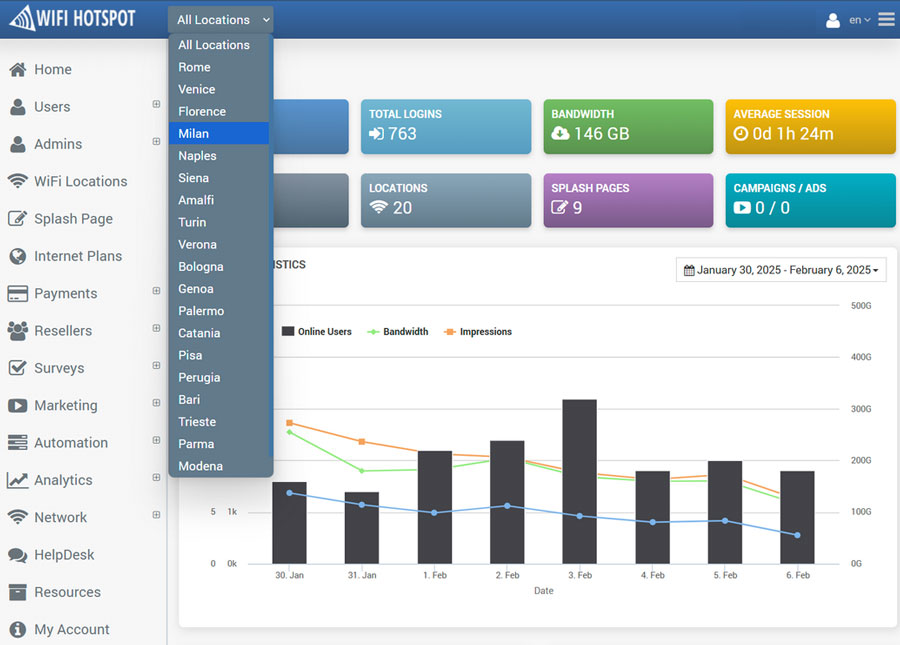
Location Filter feature allows filtering by individual WiFi locations. Selecting a location updates all dashboard stats to reflect only that site’s data—ideal for multi-location networks.
Location Filter segment user data and analytics by specific WiFi locations for targeted insights and management. This feature lets you select a location from a dropdown to filter users, dashboard statistics, and analytics based on where users first connected. All key metrics—logins, bandwidth, session times, loyalty, and revenue—automatically update to reflect data from the selected location, making it easy to monitor performance across multiple sites.
Selecting All Locations resets the view to show aggregated, network-wide data.
This real-time segmentation transforms the Cloud WiFi Dashboard into a powerful control panel for localized analysis and decision-making.