
Sessions
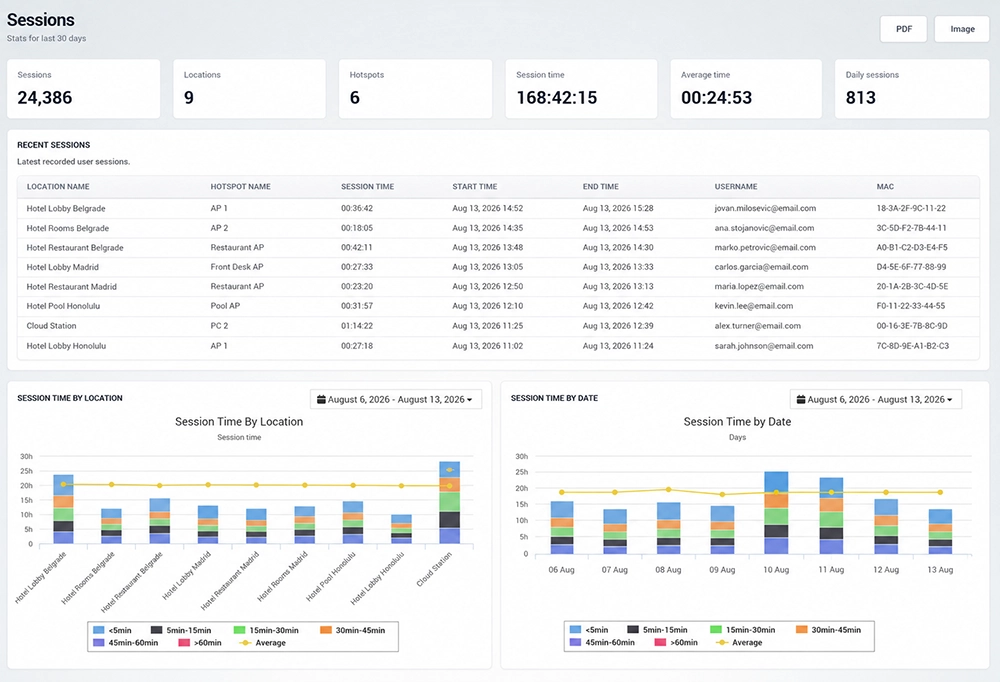
The Sessions analytics page provides a clear overview of guest activity across your WiFi network. Track the number of sessions, connected locations and hotspots, total usage time, average session duration, and daily activity from one dashboard.
Session Overview
At the top of the page, key statistics provide a quick summary of WiFi usage for the selected reporting period:
Sessions – Total number of recorded user sessions.
Locations – Number of locations included in the report.
Hotspots – Number of hotspots that recorded user activity.
Session Time – Total accumulated time of all user sessions.
Average Time – Average duration of a user session.
Daily Sessions – Average number of sessions per day.
These metrics make it easy to understand overall guest WiFi usage and compare activity between different reporting periods.
Recent Sessions
The Recent Sessions table displays the latest recorded user activity.
For each session, you can review:
Location name
Hotspot name
Session duration
Start time
End time
Username
Device MAC address
This information can help administrators review individual connections and identify when, where, and for how long users accessed the WiFi network.
Session Time by Location
The Session Time by Location chart shows how WiFi usage is distributed across individual locations.
Sessions are grouped by duration, making it easier to see whether a location mainly generates short visits or longer user sessions. The average session time is displayed as a separate line for easier comparison between locations.
Use the date selector above the chart to analyze activity for a specific period.
Session Time by Date
The Session Time by Date chart shows session activity over time.
Each day is divided into session-duration groups:
Less than 5 minutes
5–15 minutes
15–30 minutes
30–45 minutes
45–60 minutes
More than 60 minutes
The average session duration is also displayed, allowing you to quickly identify changes in guest usage patterns from day to day.
How to Use Sessions Analytics
Open Analytics → Sessions.
Review the summary statistics at the top of the page.
Check Recent Sessions for detailed information about the latest user connections.
Select the required date range for the charts.
Compare session duration between locations using Session Time by Location.
Review daily usage trends using Session Time by Date.
Use PDF or Image to export the report when you need to save or share the analytics.
Sessions analytics can help you understand guest behavior, compare WiFi usage between locations, and identify changes in network activity over time.