
Revenue
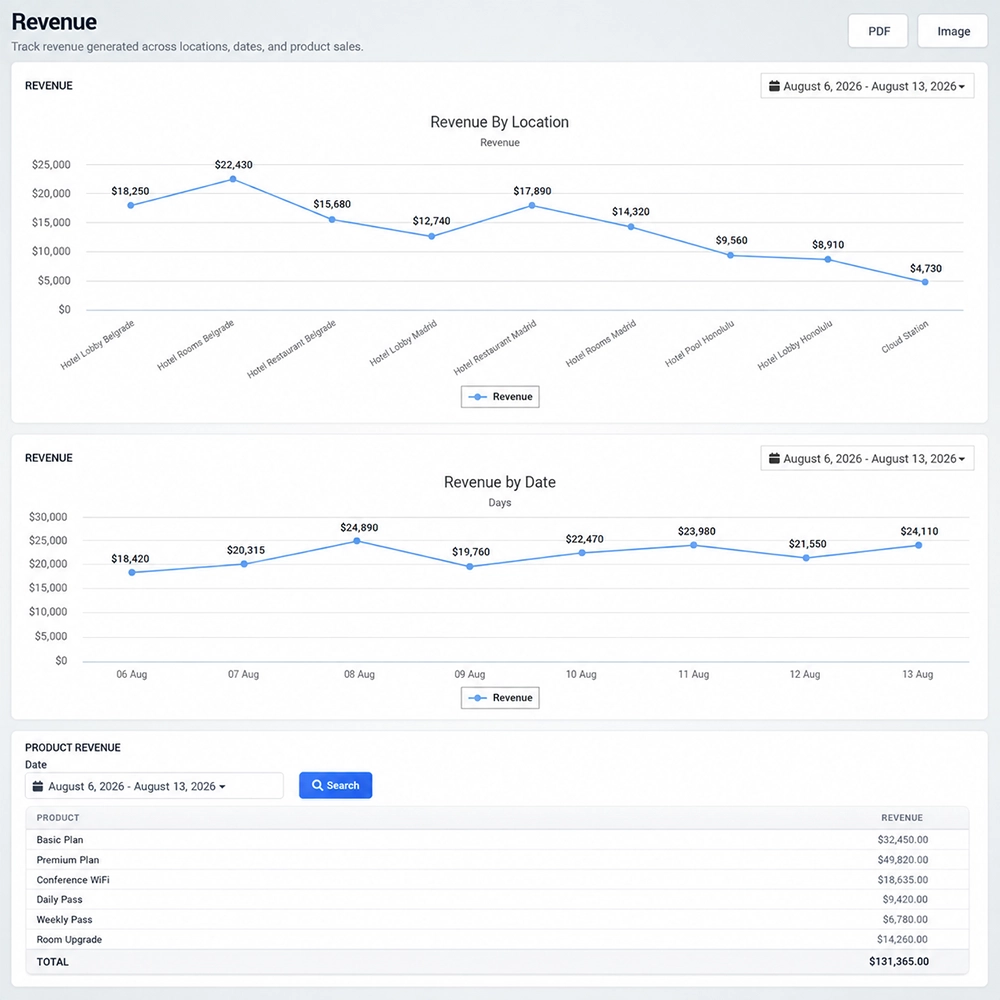
The Revenue analytics page provides an overview of revenue generated through WiFi services. Administrators can compare revenue across locations, monitor revenue trends over time, and analyze how much income is generated by individual products or access plans.
Revenue by Location
The Revenue by Location chart shows the revenue generated at each managed location during the selected reporting period.
Each location is displayed separately, making it easy to compare performance across different sites.
Use this report to:
Identify locations generating the highest revenue.
Compare revenue performance between properties or venues.
Detect locations with lower-than-expected sales.
Track how revenue is distributed across the WiFi network.
The date selector above the chart allows you to change the reporting period.
Revenue by Date
The Revenue by Date chart shows how revenue changes over time.
Each point represents the revenue generated for a specific date within the selected period.
This view helps administrators identify:
High-revenue days.
Periods with lower sales.
Changes in revenue over time.
Recurring revenue patterns.
Comparing daily revenue can also help determine whether promotions, events, increased visitor activity, or other operational changes affect WiFi sales.
Product Revenue
The Product Revenue section shows how much revenue is generated by individual products or access plans.
For each product, the report displays:
Product – Name of the WiFi product, plan, or service sold.
Revenue – Total revenue generated by that product during the selected period.
The Total row displays the combined revenue generated by all listed products.
This report makes it easy to identify which products contribute the most to overall revenue.
Filter Product Revenue by Date
Use the date selector in the Product Revenue section to define the period you want to analyze.
After selecting the required date range, click Search to update the report.
This allows product sales to be compared across different periods without changing the other revenue charts.
Select a Reporting Period
Use the date selectors available in the Revenue report to define the period included in the analysis.
Changing the reporting period allows you to compare:
Revenue between locations.
Revenue on different dates.
Product sales across different periods.
This is useful when evaluating short-term sales performance as well as longer revenue trends.
Export Revenue Reports
Use PDF or Image in the upper-right corner to save or share the Revenue analytics report.
These options are useful for management reports, financial reviews, presentations, or comparing WiFi revenue performance between reporting periods.
How to Use Revenue Analytics
Open Analytics → Revenue.
Select the reporting period you want to analyze.
Review Revenue by Location to compare income between managed locations.
Check Revenue by Date to identify revenue trends and high-performing days.
Review Product Revenue to determine which products or access plans generate the most income.
Select a specific date range in Product Revenue when a different sales period needs to be analyzed.
Click Search to refresh the Product Revenue report.
Compare individual product revenue with the total revenue shown at the bottom of the table.
Use PDF or Image when the report needs to be saved or shared.
Revenue analytics help administrators understand where WiFi revenue is generated, identify the best-performing locations and products, and monitor changes in sales performance over time.