
Reports
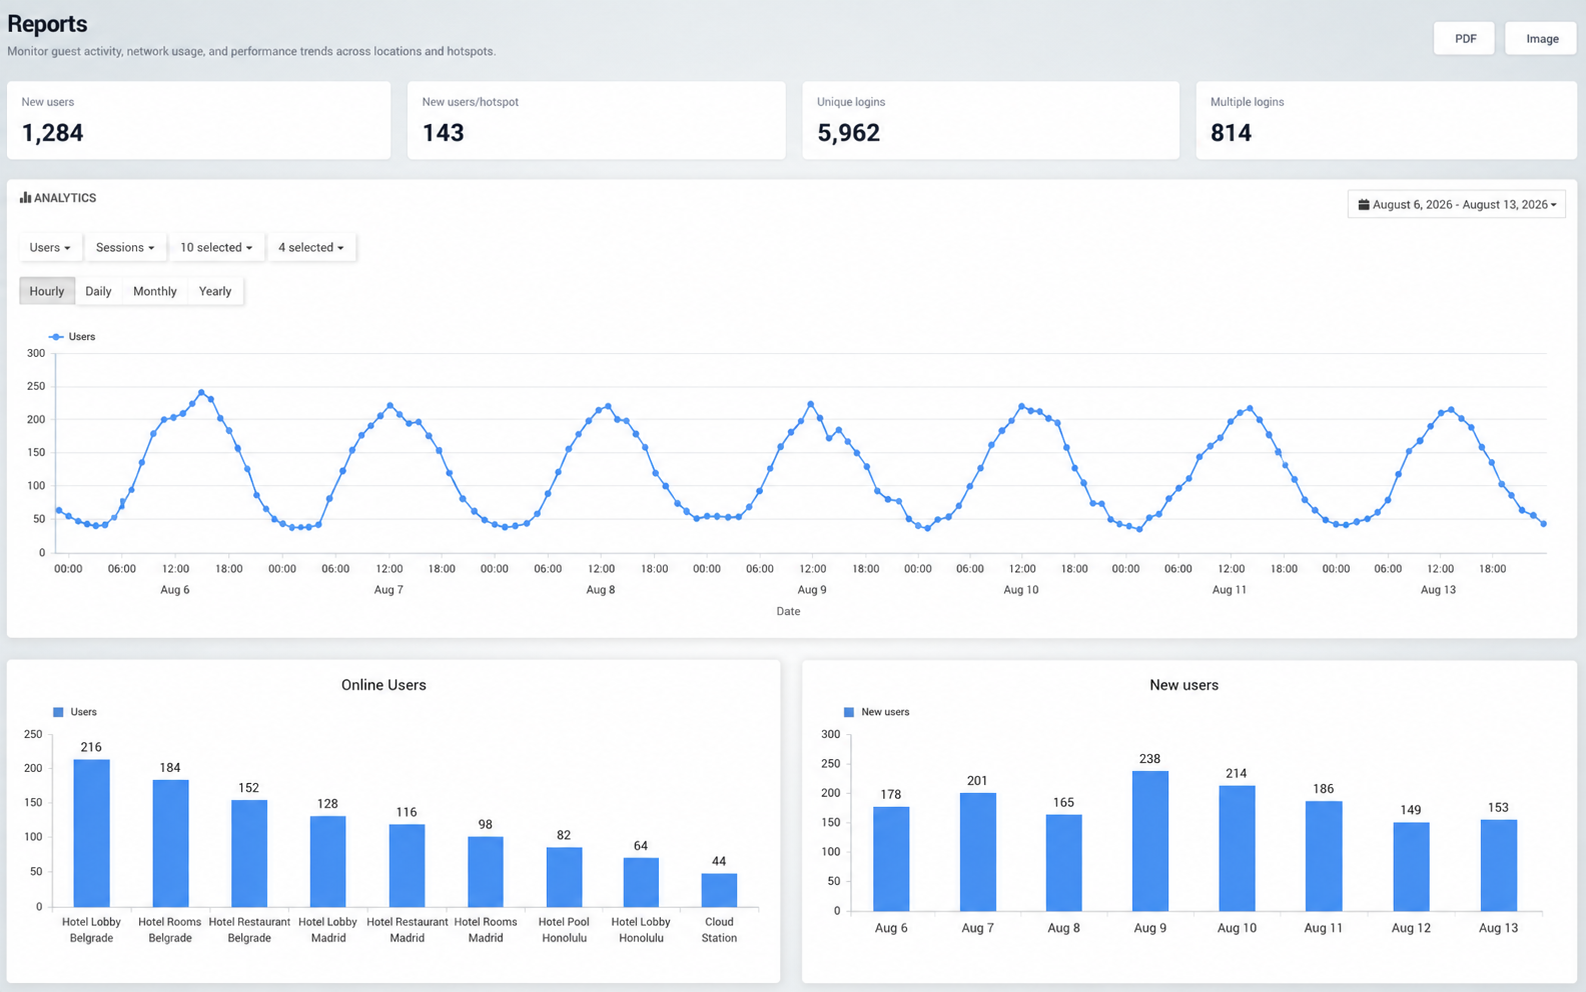
The Reports analytics page provides a consolidated view of WiFi activity across users, sessions, locations, and hotspots. It allows administrators to compare usage trends over time, monitor current activity, and review how new and returning users interact with the network.
Report Overview
The summary at the top of the page highlights key statistics for the selected reporting period:
New Users – Number of newly recorded users.
New Users/Hotspot – Average number of new users per hotspot.
Unique Logins – Unique login activity recorded during the selected reporting period.
Multiple Logins – Repeated login activity recorded during the selected reporting period.
These metrics provide a quick overview of user acquisition and login activity before reviewing more detailed analytics.
Analytics Report
The main Analytics chart allows you to analyze network activity in more detail.
You can select the type of data you want to review, such as users or sessions, and filter the report by the available locations and hotspots.
The selected date range determines the period included in the analysis.
Select Report Interval
The analytics chart can be displayed using different time intervals:
Hourly
Daily
Monthly
Yearly
Use the interval that best matches the period you want to analyze.
Hourly reports are useful for identifying peak usage times during the day, while daily, monthly, and yearly views provide a broader overview of usage trends.
Filter by Locations and Hotspots
Use the available selectors above the chart to define which parts of the WiFi network should be included in the report.
You can select multiple locations or hotspots, allowing activity to be analyzed across the entire network or narrowed to specific areas.
This is particularly useful when managing WiFi across multiple properties or sites.
Online Users
The Online Users chart shows the number of currently active users across locations or hotspots.
This makes it easy to compare real-time WiFi activity and identify which locations currently have the highest number of connected users.
New Users
The New Users chart shows how many new users were recorded during each period.
Use this chart to identify days or periods with higher user acquisition and compare how the number of new WiFi users changes over time.
Select a Reporting Period
Use the date selector in the upper-right corner of the Analytics section to define the period included in the report.
Changing the reporting period updates the analytics data and allows you to compare network activity across different dates.
Export Reports
Use PDF or Image in the upper-right corner to save or share the current report.
These options are useful when analytics need to be included in internal reports, presentations, or operational reviews.
How to Use Reports Analytics
Open Analytics → Reports.
Review the summary statistics at the top of the page.
Select the type of data you want to analyze.
Choose the locations and hotspots that should be included.
Select the reporting period.
Choose Hourly, Daily, Monthly, or Yearly depending on the level of detail required.
Review the main analytics chart for usage trends.
Check Online Users to compare current activity across locations.
Review New Users to monitor user acquisition over time.
Use PDF or Image when the report needs to be saved or shared.
Reports analytics provide a flexible way to compare WiFi activity across locations and hotspots, identify usage trends, monitor online users, and track new user growth from a single dashboard.