
Bandwidth
The Bandwidth analytics page provides a detailed overview of network traffic generated by WiFi users. Administrators can monitor total data usage and analyze how bandwidth is distributed across users, locations, hotspots, and individual days.
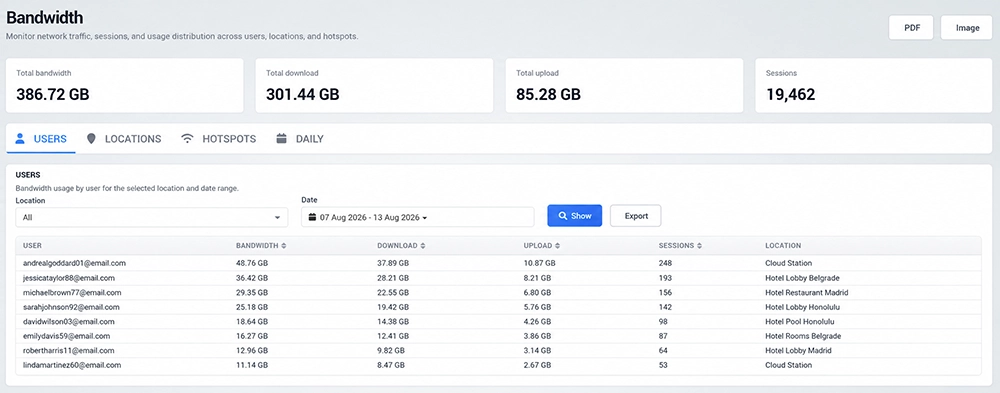
Bandwidth Overview
The summary at the top of the page displays the main network usage statistics for the selected reporting period:
Total Bandwidth – Combined amount of downloaded and uploaded data.
Total Download – Total amount of data downloaded by WiFi users.
Total Upload – Total amount of data uploaded by WiFi users.
Sessions – Total number of user sessions included in the report.
These values provide a quick overview of overall WiFi traffic before reviewing more detailed usage information.
Analyze Bandwidth Usage
Bandwidth statistics can be viewed from four different perspectives:
Users – Review bandwidth consumption by individual WiFi users.
Locations – Compare network traffic between different locations.
Hotspots – Analyze bandwidth usage generated through individual hotspots.
Daily – Review how network traffic changes from day to day.
Use these views to identify where network traffic is generated and how usage is distributed across the WiFi network.
Bandwidth by User
The Users view displays bandwidth consumption for individual WiFi users.
For each user, the table shows:
User
Total bandwidth
Download traffic
Upload traffic
Number of sessions
Location
This makes it easy to identify users generating higher levels of network traffic and compare their usage with the number of recorded sessions.
Filter by Location and Date
Use the available filters to narrow the bandwidth report.
Location allows you to display users from a specific location or review all locations together.
Date allows you to select the reporting period that should be included in the bandwidth analysis.
After selecting the required filters, click Show to update the report.
Locations and Hotspots
Use the Locations and Hotspots tabs when you need a broader view of network usage instead of individual user activity.
The Locations view helps compare bandwidth consumption between managed sites, while the Hotspots view allows traffic to be analyzed according to the hotspot through which users connected.
These reports are useful for identifying locations or hotspots that generate significantly more network traffic than others.
Daily Bandwidth Usage
The Daily view provides a time-based overview of network traffic.
Use this report to identify changes in bandwidth consumption over the selected period and recognize days with unusually high or low network activity.
Daily reporting is particularly useful when comparing traffic trends with the number of WiFi sessions.
Export Bandwidth Reports
Use Export to export the detailed bandwidth data displayed in the selected report.
The PDF and Image options at the top of the page can be used to save or share the analytics overview in a convenient report format.
How to Use Bandwidth Analytics
Open Analytics → Bandwidth.
Review Total Bandwidth, Download, Upload, and Sessions at the top of the page.
Select Users, Locations, Hotspots, or Daily depending on the information you want to analyze.
Select the required location when applicable.
Choose the reporting period.
Click Show to apply the selected filters.
Review download, upload, total bandwidth, and session information.
Use Export when detailed report data is required outside the dashboard.
Use PDF or Image to save or share the analytics overview.
Bandwidth analytics help administrators understand network consumption, identify high-usage users or locations, compare hotspot traffic, and monitor changes in WiFi usage over time.